IC Markets Trang chủ Đăng nhập Web Trader Liên hệ chúng tôi
IC Markets Social IC Markets Social

Information Hub for
Serious Traders

  • Thông tin về chúng tôi
  • Mở tài khoản giao dịch
  • Mở tài khoản giao dịch demo
  • Truy cập vào blog
  • THĂM CỦA CHÚNG TÔI BLOG
IC Markets Social
  • Thông tin về chúng tôi
  • Mở tài khoản giao dịch
  • Mở tài khoản giao dịch demo
  • Truy cập vào blog
  • THĂM CỦA CHÚNG TÔI BLOG
July 30, 2024Australian_Stocks_enIC Markets

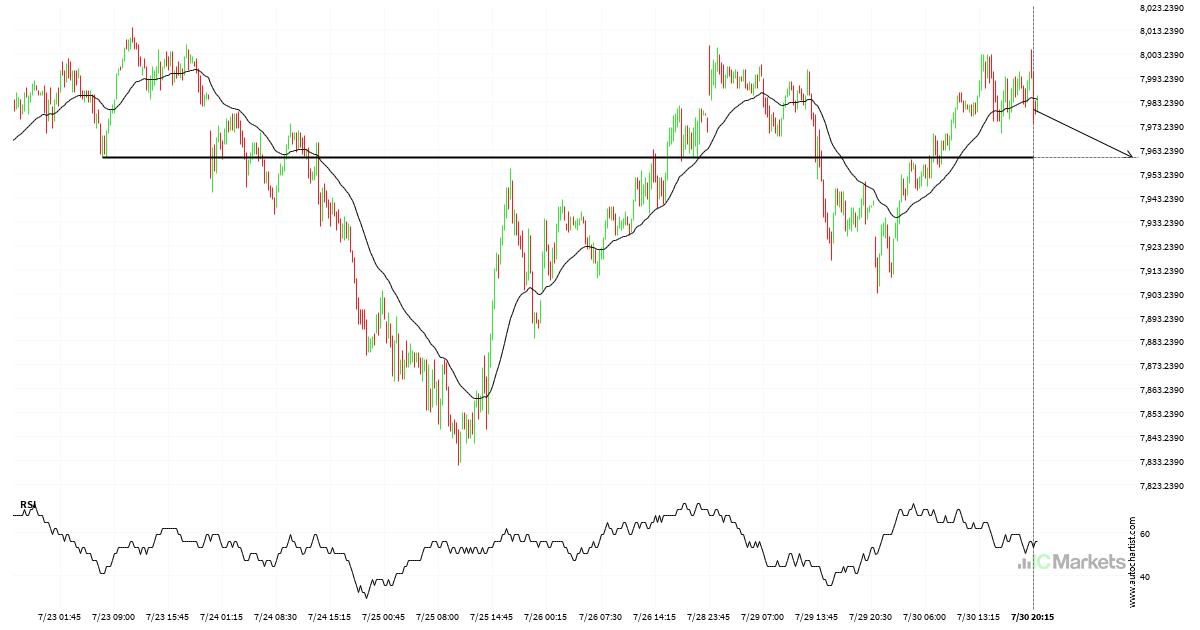
Australia 200 Index approaching support level

Australia 200 Index is heading towards a line of 7960.1001. If this movement continues, the price of Australia 200 Index could test 7960.1001 within the next 2 days. But don’t be so quick to trade, it has tested this line numerous times in the past, so this movement could be short-lived and end up rebounding.

Read more
July 30, 2024Australian_Stocks_enIC Markets

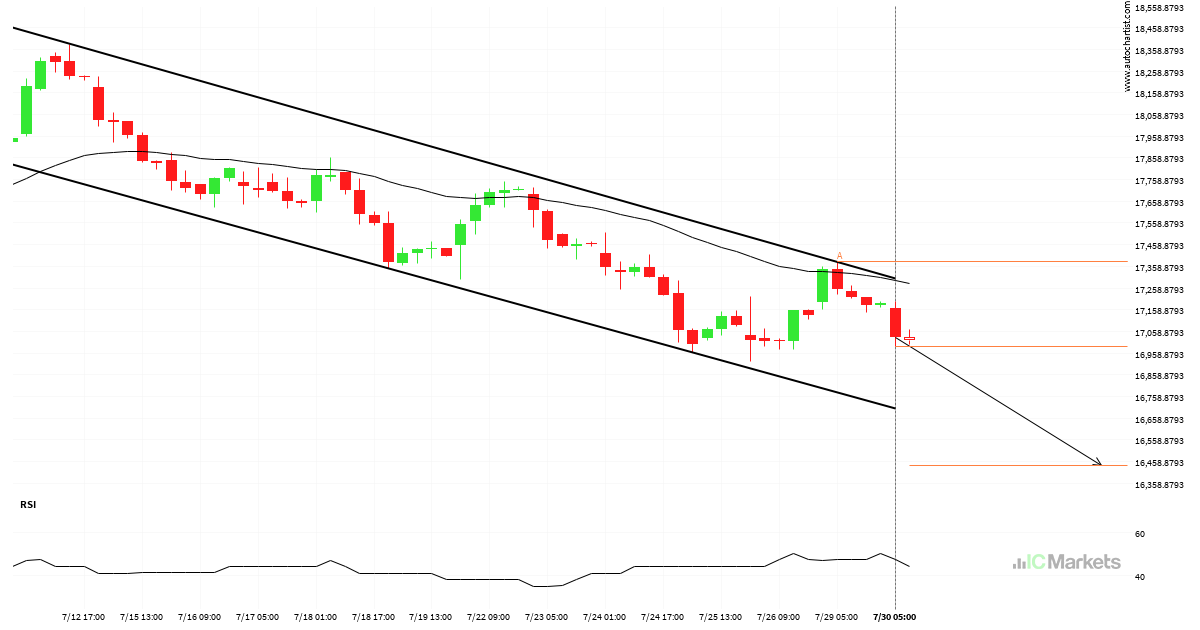
Will Hong Kong 50 Index have enough momentum to break support?

Hong Kong 50 Index was identified at around 16989.31 having recently rebounded of the resistance on the 4 hour data interval. Ultimately, the price action of the stock has formed a Channel Down pattern. This squeeze may increases the chances of a strong breakout. The projected movement will potentially take the price to around the […]

Read more
July 29, 2024Australian_Stocks_enIC Markets

A potential bullish movement on Hong Kong 50 Index

Hong Kong 50 Index is moving towards a key resistance level at 17429.0195. Hong Kong 50 Index has previously tested this level 3 times and on each occasion it has bounced back off this level. Is this finally the time it will break through?

Read more
July 28, 2024Australian_Stocks_enIC Markets

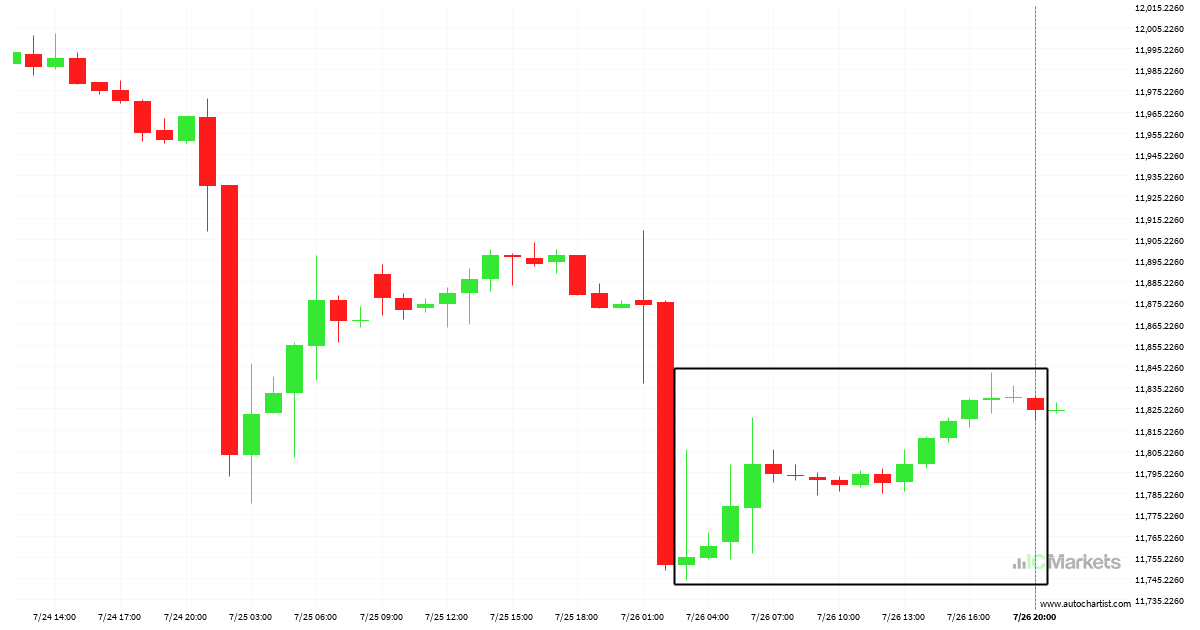
Where is FTSE China A50 Index moving to?

An unexpected large move has occurred on FTSE China A50 Index 1 hour chart beginning at 11750.8 and ending at 11829.2. Is this a sign of something new? What can we expect in the future?

Read more
July 26, 2024Australian_Stocks_enIC Markets

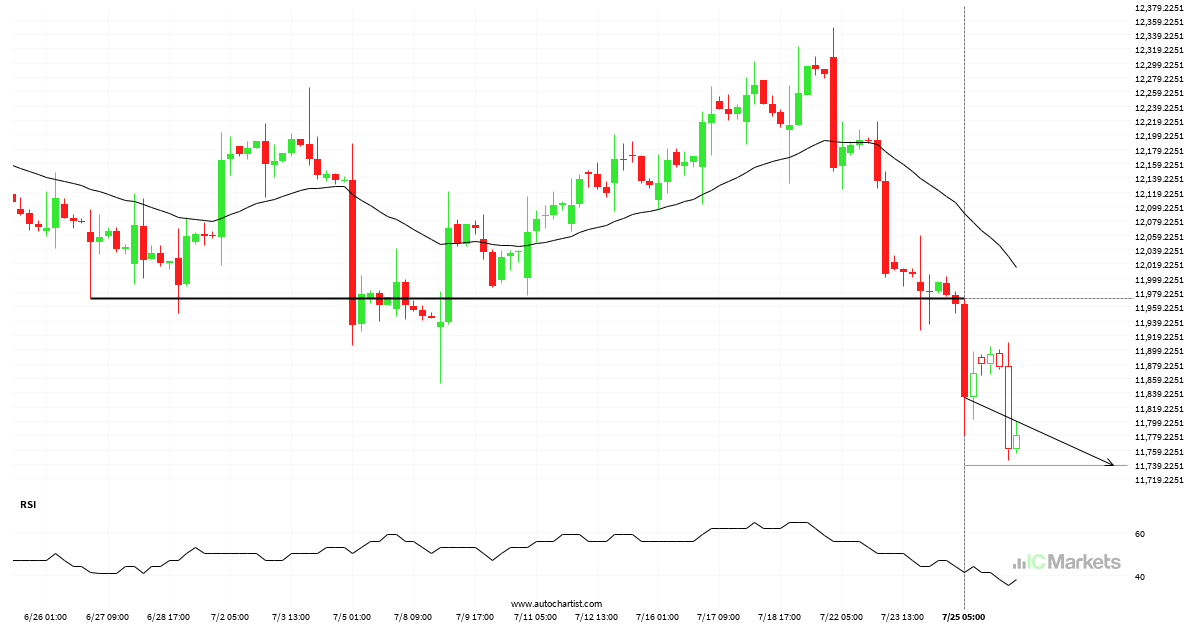
Should we expect a bearish trend on FTSE China A50 Index?

FTSE China A50 Index has broken through a support line. Because we have seen it retrace from this price in the past, one should wait for confirmation of the breakout before trading. It has touched this line numerous times in the last 29 days and suggests a possible target level to be around 11738.4082 within […]

Read more
July 25, 2024Australian_Stocks_enIC Markets

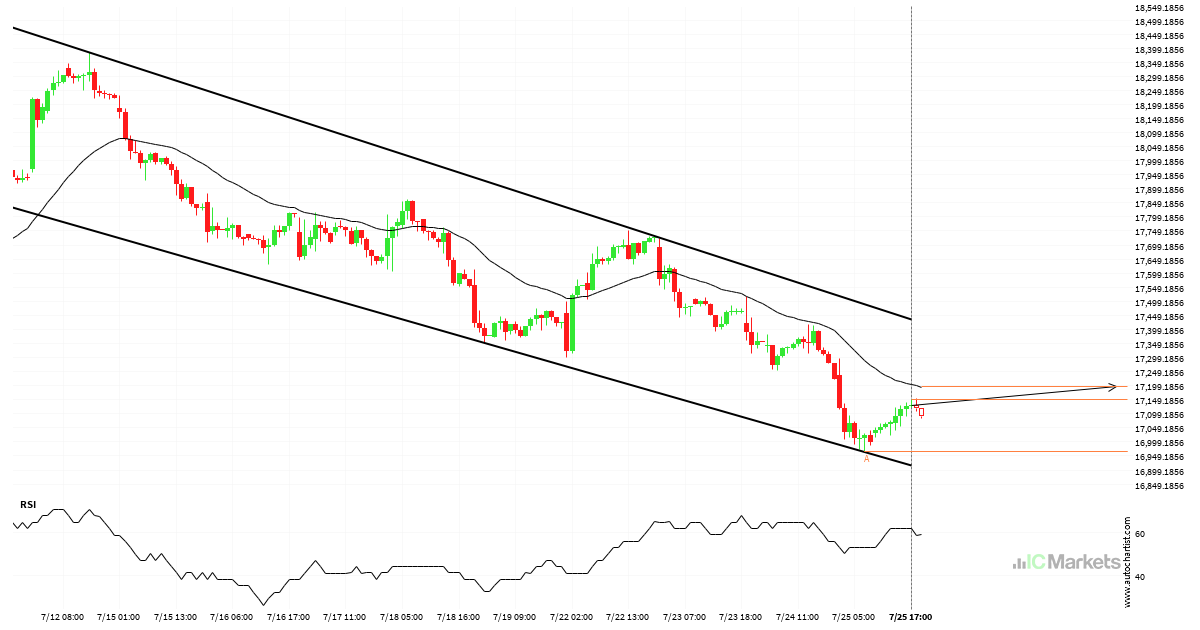
Will Hong Kong 50 Index have enough momentum to break resistance?

Hong Kong 50 Index is heading towards the resistance line of a Channel Down. If this movement continues, the price of Hong Kong 50 Index could test 17195.6192 within the next 3 days. It has tested this line numerous times in the past, so this movement could be short-lived and end up rebounding just like […]

Read more
July 24, 2024Australian_Stocks_enIC Markets

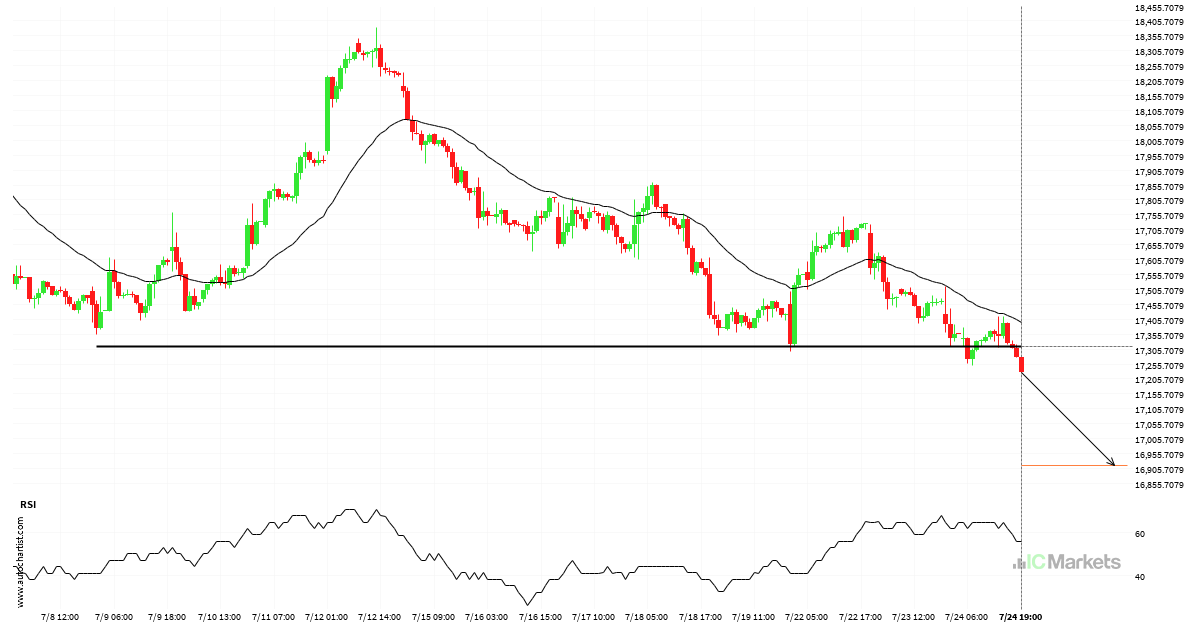
Big movement possible on Hong Kong 50 Index

Hong Kong 50 Index has broken through a support line. It has touched this line numerous times in the last 16 days. This breakout shows a potential move to 16916.8711 within the next 3 days. Because we have seen it retrace from this level in the past, one should wait for confirmation of the breakout.

Read more
July 23, 2024Australian_Stocks_enIC Markets

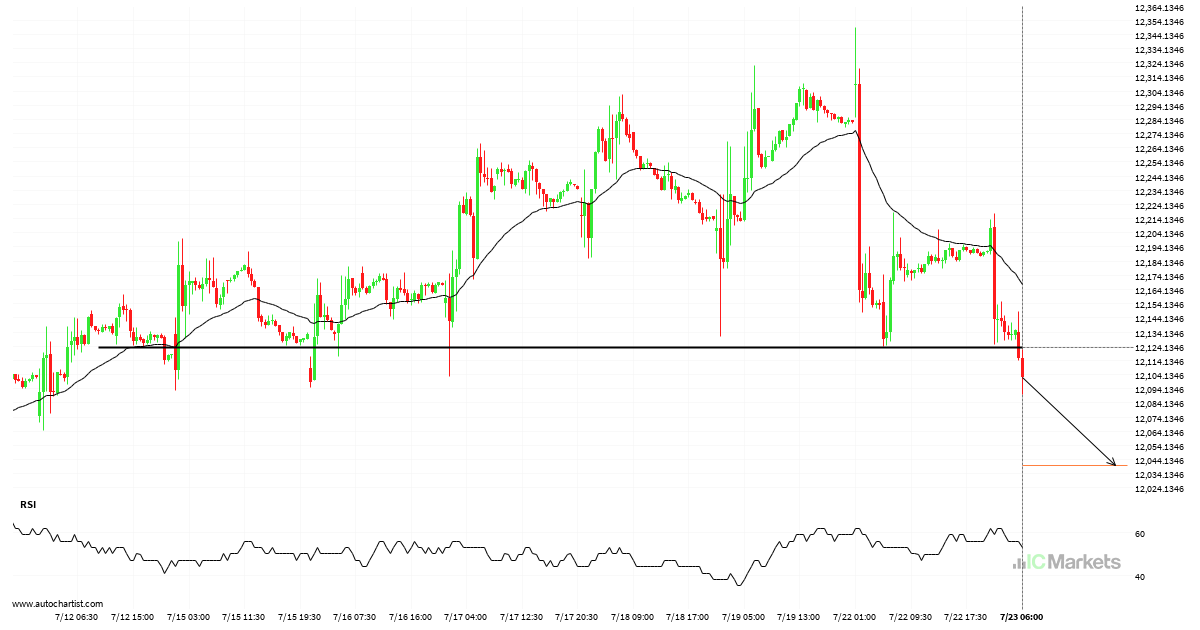
FTSE China A50 Index broke through important 12123.0498 price line

The breakout of FTSE China A50 Index through the 12123.0498 price line is a breach of an important psychological price that is has tested numerous in the past. If this breakout persists, FTSE China A50 Index could test 12040.2188 within the next 2 days. One should always be cautious before placing a trade, wait for […]

Read more
July 22, 2024Australian_Stocks_enIC Markets

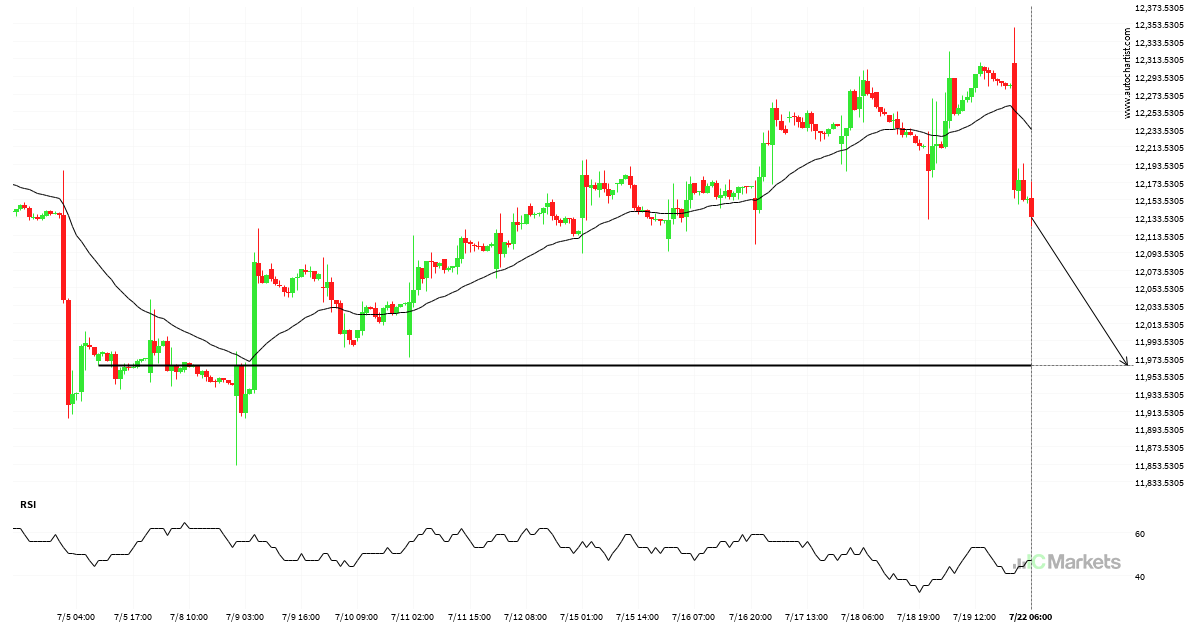
Breach of important price line imminent by FTSE China A50 Index

The movement of FTSE China A50 Index towards 11965.6797 price line is yet another test of the line it reached numerous times in the past. We could expect this test to happen in the next 3 days, but it is uncertain whether it will result in a breakout through this line, or simply rebound back […]

Read more
July 21, 2024Australian_Stocks_enIC Markets

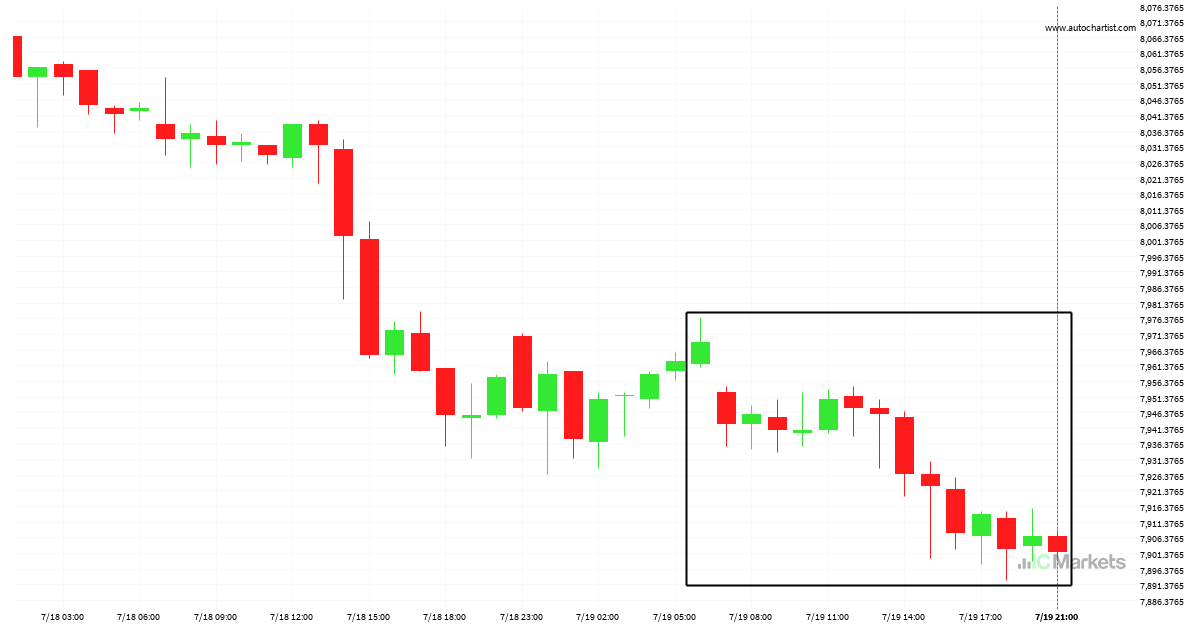
Australia 200 Index experienced an exceptionally large movement

Australia 200 Index has experienced an exceptionally large movement lower by 0.84% from 7968.7 to 7901.7 in the last 15 hours.

Read more
  • 1
  • 2
  • 3
  • …
  • 5
  • 6
  • 7
  • 8
  • 9
  • 10
  • 11
  • …
  • 153
  • 154
  • 155

Recent Posts

  • Either a rebound or a breakout imminent on SILVER
  • GOLD Nível visado: 2976.3601
  • A potential bearish movement on GOLD
  • มีโอกาสเกิดการเคลื่อนตัวแบบ bearish บน GOLD
  • Posible gran movimiento en el AUDJPY

Recent Comments

    Translation


     Edit Translation

    Mở & nạp tiền vào tài khoản nhanh chóng

    Giao dịch trong vòng vài phút!

    BẮT ĐẦU THỬ TÀI KHOẢN DEMO MIỄN PHÍ

    Giao dịch Forex

    • Tổng quan về Tài khoản
    • Mở Tài khoản
    • Khởi chạy Web Trader

    Thông số Giao dịch

    • Chênh lệch và Hoa hồng
    • Phạm vi các Thị trường
    • Giờ Giao dịch
    • Nạp tiền
    • Rút tiền

    About IC Markets

    • Help Center
    • Tại sao lại chọn IC Markets?
    • Quản lý
    • Tài liệu Pháp lý
    • Liên hệ với Chúng tôi


    Forex Trading

    • Accounts Overview
    • Open an Account
    • Launch Web Trader

    Trading Specifications

    • Spreads and Commissions
    • Range of Market
    • Trading Hours
    • Funding
    • Withdrawal

    About IC Markets

    • Chat with a Specialist 24/7
    • Why IC Markets
    • Regulation
    • Legal Documents
    • Liên hệ chúng tôi

    Khước từ trách nhiệm: Tài liệu này là tài liệu marketing mà ở đó tất cả tài liệu marketing đều được xuất bản chỉ nhằm mục đích thông tin. Tài liệu này không chứa và không nên được coi là chứa - lời khuyên và khuyến nghị đầu tư, hoặc đề xuất thực hiện bất kỳ hành động nào với các công cụ tài chính. Các widget được tích hợp thuộc về các tác giả độc lập bên ngoài, và IC Markets không chịu trách nhiệm về nội dung và tác động của chúng đối với giao dịch.

    Bảo lưu mọi quyền. Quan điểm của tác giả có thể không trùng khớp với quan điểm của biên tập viên blog. Khi sao chép các tài liệu từ trang này hoặc kết nối với bản tin RSS để xuất bản lại các bài viết của chúng tôi, một liên kết tới IC Markets hoặc thuộc tính trong định dạng ‘Blog của IC Markets’ được yêu cầu. Đối với các thắc mắc nói chung, vui lòng liên hệ với phòng biên tập qua biểu mẫu trên trang Liên hệ với chúng tôi.

    Cảnh báo về Rủi ro: Giao dịch Phái sinh tiềm ẩn mức độ rủi ro cao với vốn của bạn và bạn chỉ nên giao dịch với số tiền mà bạn có thể để mất. Giao dịch Sản phẩm phái sinh có thể không phù hợp với mọi nhà đầu tư, do đó vui lòng đảm bảo rằng bạn hiểu đầy đủ các rủi ro có liên quan và tìm kiếm sự tư vấn độc lập nếu cần. Tuyên bố Tiết lộ sản phẩm (PDS) phải được cân nhắc trước khi tham gia bất kỳ giao dịch nào với chúng tôi.

    Nội dung của trang này chỉ nhằm mục đích thông tin chung và không cân nhắc tới tình hình cá nhân, mục tiêu hoặc nhu cầu tài chính của bạn. Việc đảm bảo các sản phẩm mà chúng tôi cung cấp có phù hợp với nhu cầu cụ thể của bạn hay không hoàn toàn tùy thuộc vào bạn. Bạn không nên giao dịch với chúng tôi trừ khi bạn hiểu các tính năng và rủi ro của các sản phẩm mà chúng tôi cung cấp. Điều này có nghĩa là bạn có thể tìm kiếm sự tư vấn động lập trước khi bắt đầu giao dịch với chúng tôi.

    © 2022 Raw Trading Ltd | All rights reserved.
    • Sample Page